GRT-Plugin "GRTrace"
 The “GRTrace” client software and the starter-plugin is part of every GRT version (currently Windows only). GRTrace can be run standalone or via the respective plugin entry/icon in GRT.
What is GRTrace?
GRTrace is a full featured, standalone client software for strain gage based, direct on rifle/barrel pressure measurement systems and comes with an additional starter-plugin for GRT. GRT supports directly the recorded traces made with GRTrace and can overlay the pressure curves onto the simulation curves. GRT supports also the direct import of traces made with GRTrace into a measurement tab and can reference that automatically with the simulation setup.
GRTrace currently supports the product "PressureTrace II" by RSI and is a direct replacement for the original software that comes with the device, other may follow.
How it works
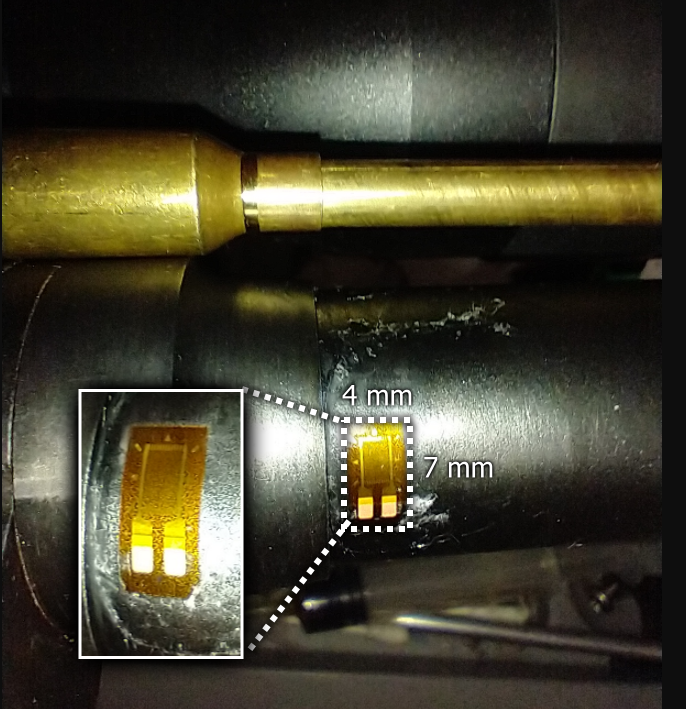 A strain gage is a small foil-type sensor with a fine conductive grid on its surface and used to measure strain on an object.
The gage is glued on a barrel and as steel around the barrel expands by pressure, the gage is stretched. The stretching causes a small resistance change of the gage, which can be measured. A oscilloscope-like measuring device samples these changes at a high frequency and stores it in a memory buffer. The raw data of around 3 Milliseconds is then automatically downloaded to the PC via a serial connection where it is analyzed and plotted by GRTrace.
- GRTrace implements the latest technology/equations for calculation
- With GRTrace you can enter your specific material specs of your barrel if known and it will calculate the pressure values from the raw data according to your specific barrel.
- You can record as many traces into one grtrace-file as fits on the screen.
- For calibration GRTrace provides a simple and easy to use calibration factor value called “theta”.
- GRTrace has a built-in simulator which simulates measurement hardware connected to a virtual rifle for evaluation/testing.
- GRTrace provides audio-commands and messages which helps you to record multiple shots in a string (Gordons voice, currently english only).
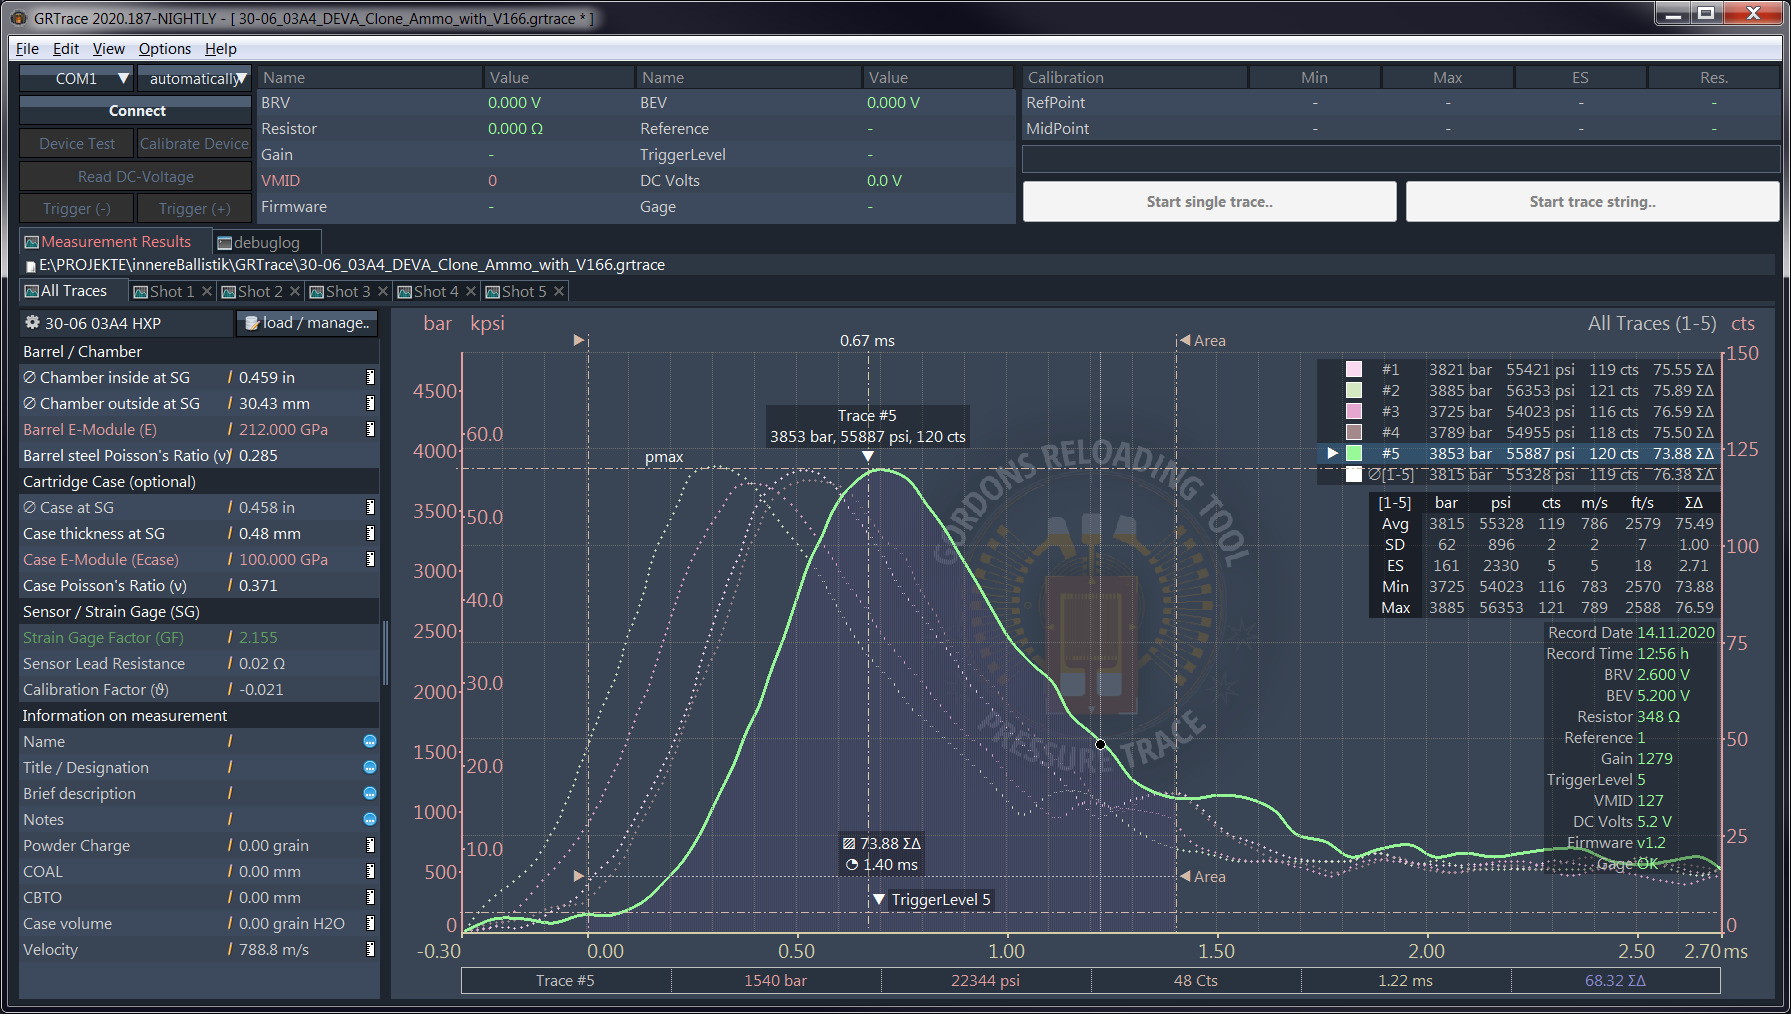
The Main Window - "All traces" view
This is how GRTrace appears after start with an opened file. In the screenshot is the tab “all traces” selected, which shows all recorded traces together. GRTrace creates an average trace curve automatically and all important statistical data is displayed.
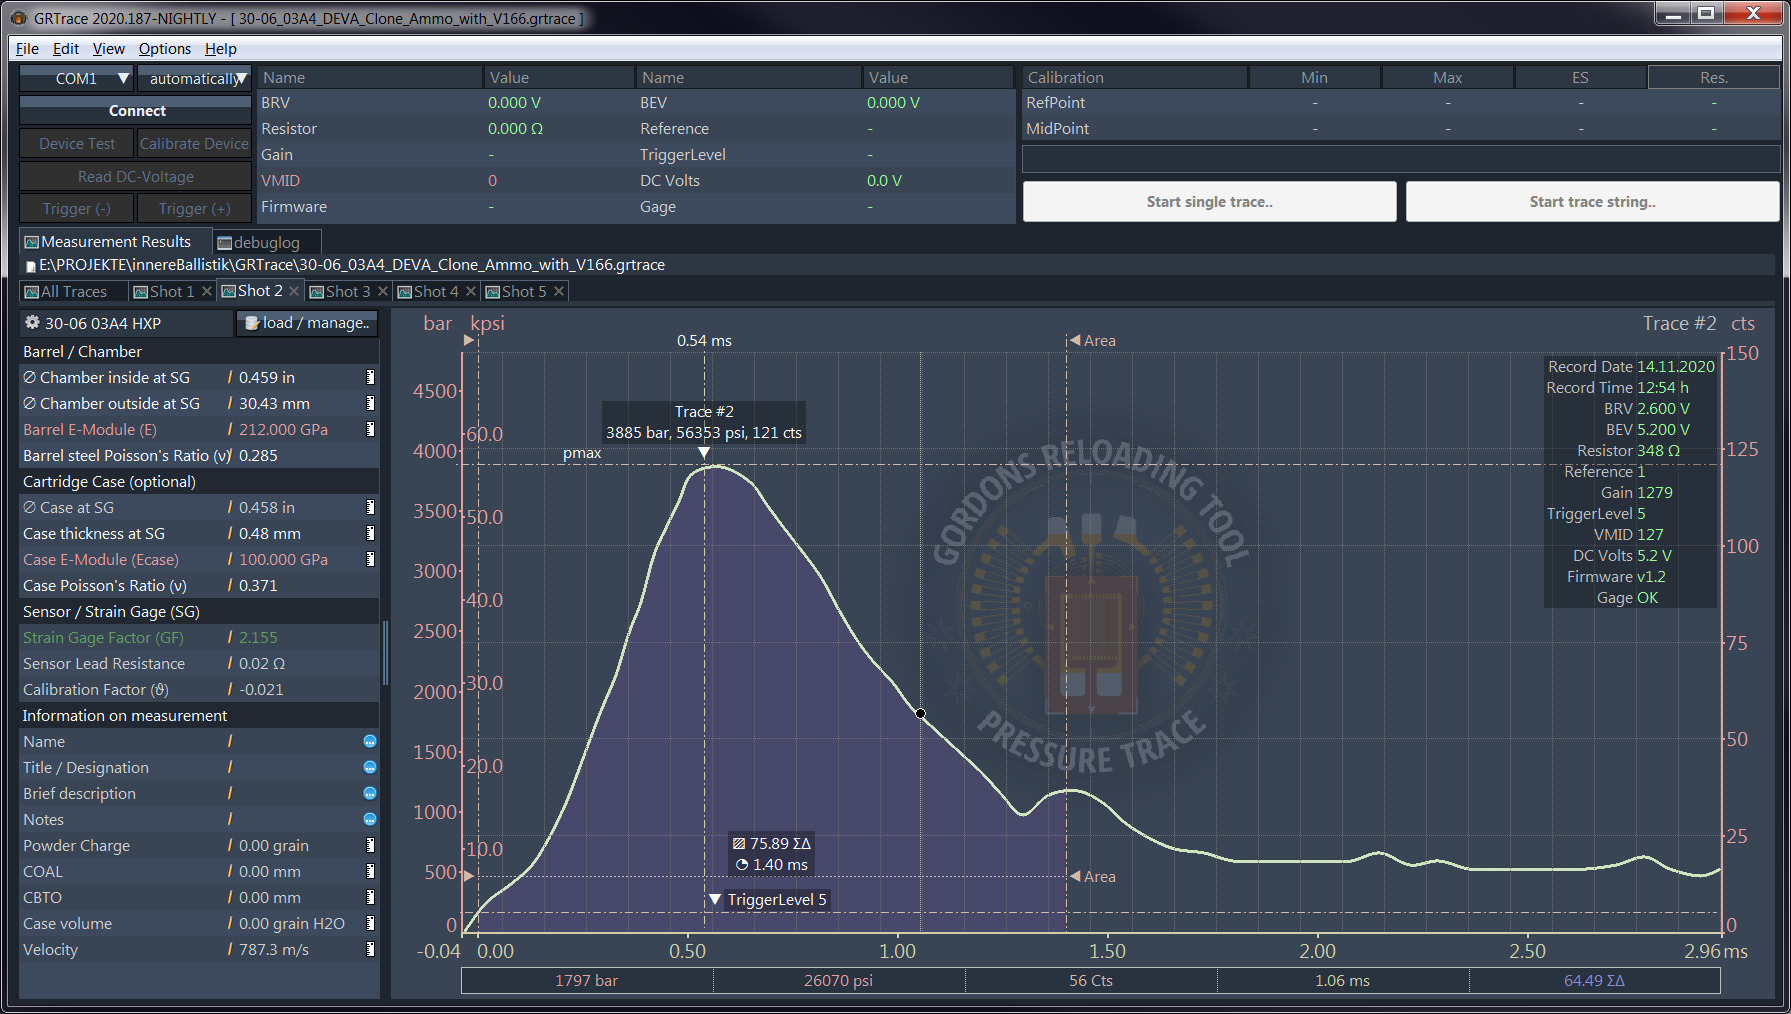
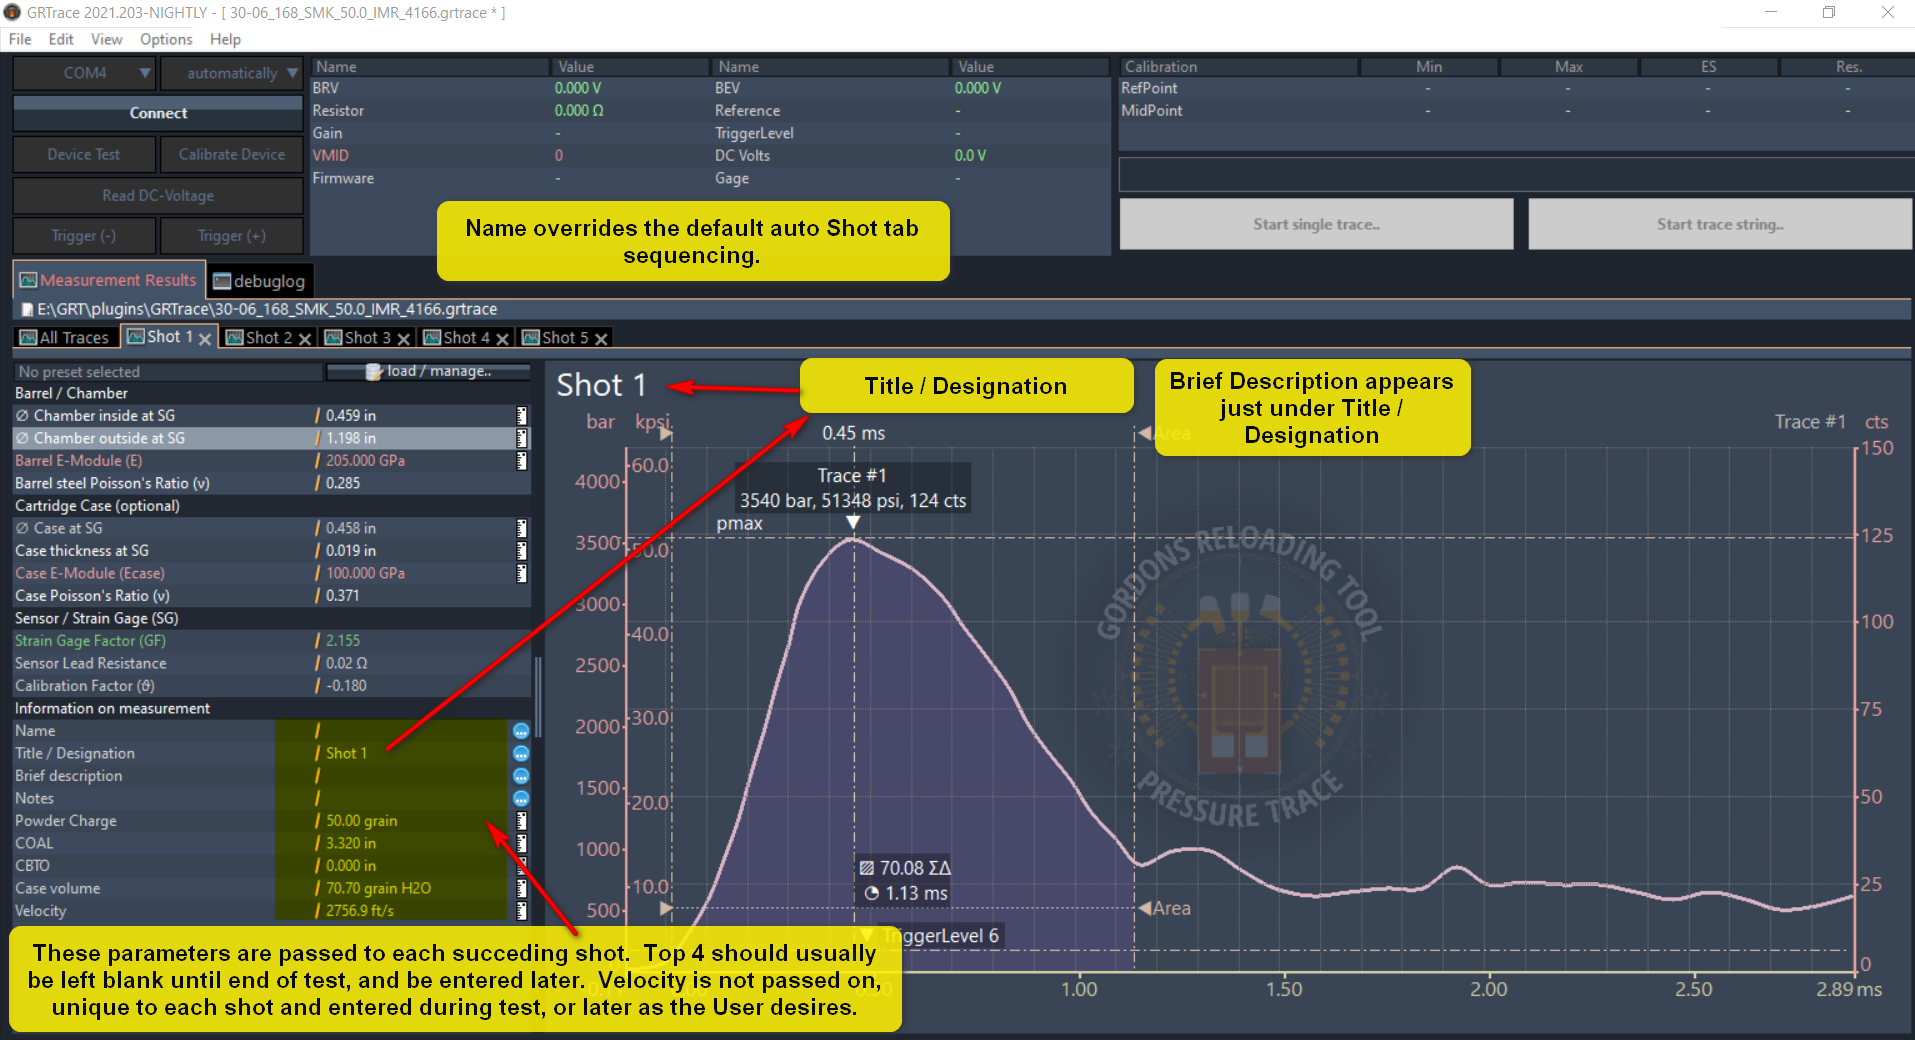
A single trace
You can move area cursors in your trace to determine the area under the curve. The area under the curve is useful to compare the delivered energy of multiple trace records.
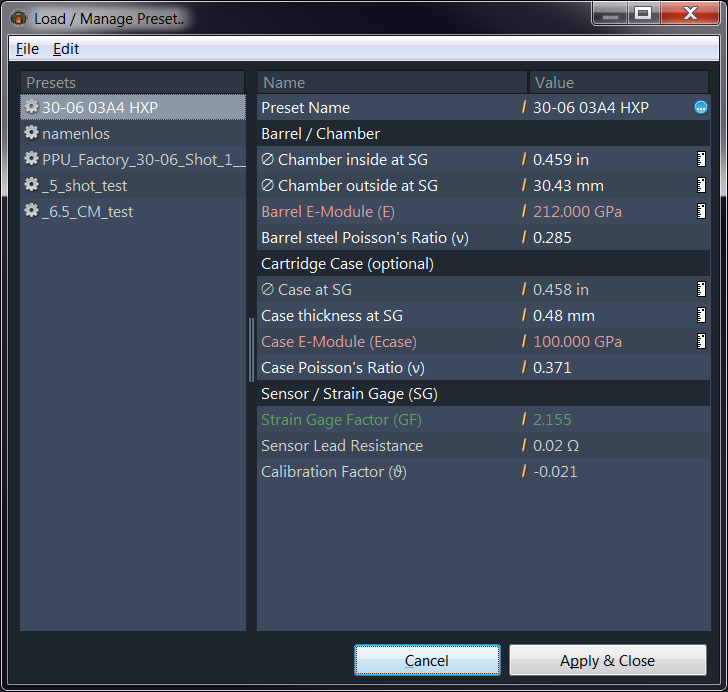
Barrel presets
You can store several barrel presets of different rifles or barrels.
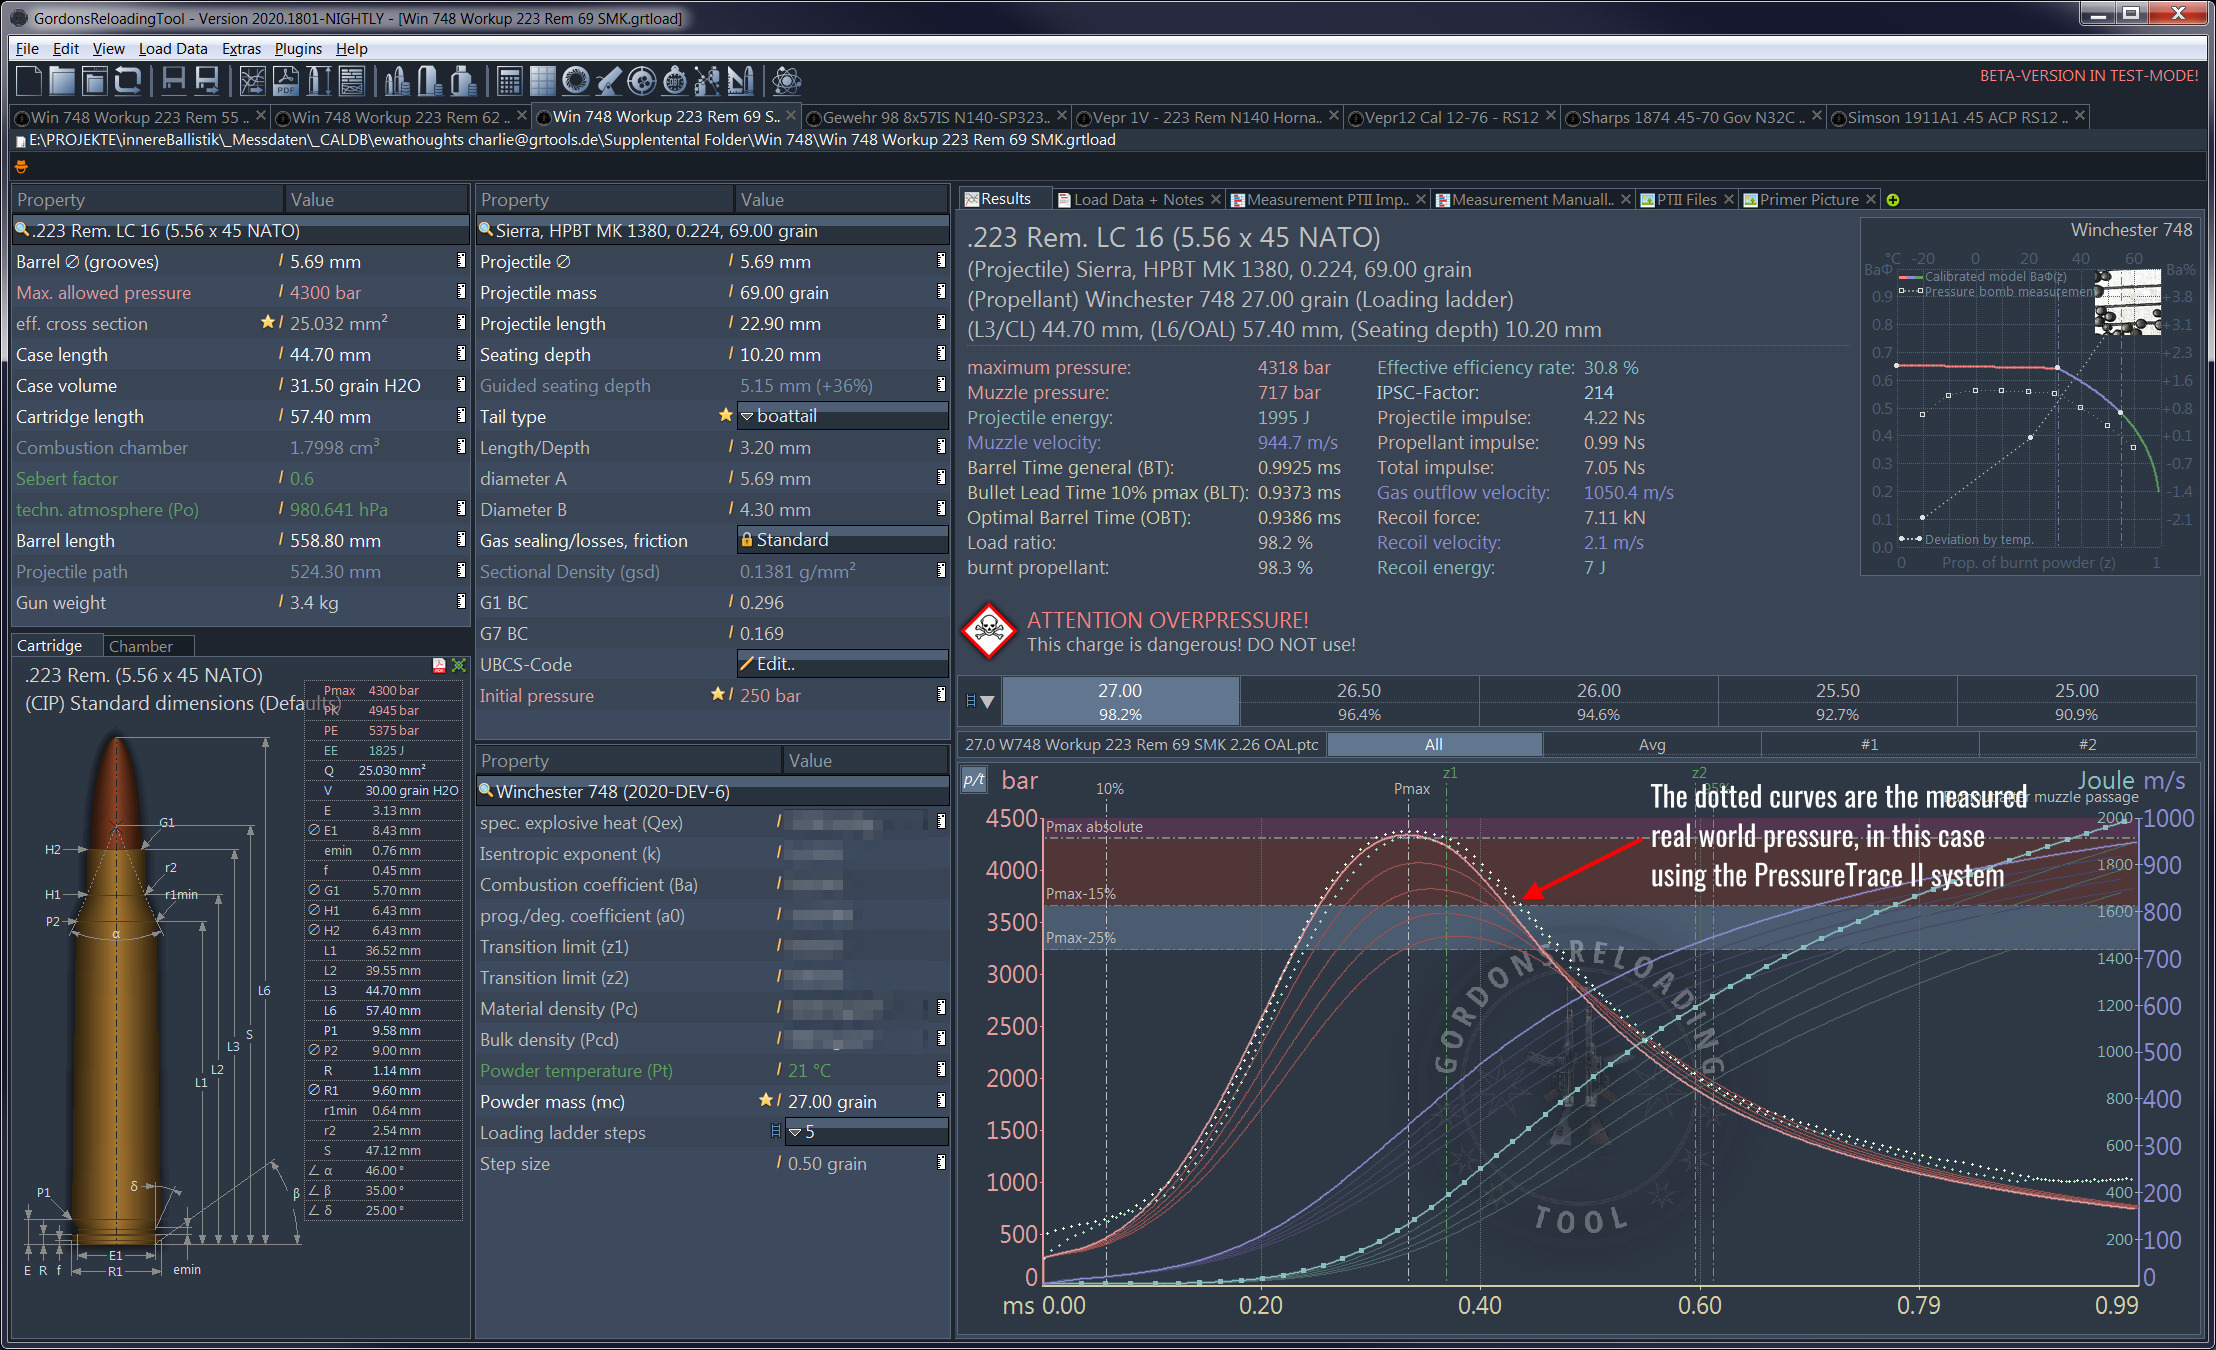
GRT curve overlay
After import of a grtrace file, you can overlay the pressure curves onto the simulation for analysis.
How to use: GRTrace Basics
One of the major advances of GRTrace is the ability to load and edit the output files (xxxxxxxx.grtrace) at any time without having the device connected. There is also a simulator option where the user can familiarize himself with the plugin operations. Additionally, the output file can be reloaded into GRTrace and the user can add additional shot test (append) as desired , and there is no shot number limit. There is a practical limit set by the Users ability to keep track of how many Result Tabs he can keep track of. Overall the GRTrace software is much easier to use, and has a more pleasant GUI. GRTrace will duplicate (pass on) certain Shot parameters to the next shot so the User does not have to repeat entries. Additionally, there is a “debuglog” kept during every session with an option to save the log for troubleshooting problems.
GRTrace can be launched from within the GRT program, or launched by invoking GRTrace.exe from the Plugin folders. A shortcut, pin to start, or pin to taskbar option is available to make launching easier, and the program is portable similar to GRT, so it can be loaded to a thumb drive and run from any PC desired.
Upon opening GRTrace, the User should familiarizes himself with the Menu Options. An important one for first time users will be the Options menu Device Simulator. This will allow the User to experience the programs functions without actually expending ammunition and range time, or hooking up the PT2 device.
GRTrace, when first opened, may display a preloaded file, or may start with a blank “noname” start up. The preloaded file is usually available in the Plugin folder for GRTrace, and is useful in seeing what fields represent what.

First time User: Start GRTrace and once it is running, open the Options menu and select the Device Simulator. Please read the disclaimer. The user should now enter in his first Barrel Preset under the shown “No preset selected” data fields below the “All Traces” tab.
- 1. First is the “Chamber diameter” adjacent to the gage location. For mid case mounted gages measure with Plastigage on a sized casing and chambered in the rifle, and extract. Just measure the casing and read the Plastigage and add the two together.
- 2. Then enter the barrel diameter at the gage location, and enter in the into the “Chamber outside at SG” field. If your gage is set ahead of the mouth of the case, skip to step 5.
- 3. For mid case gages the “Case at SG” field is the same as the above “Chamber diameter” minus the Plastigage value.
- 4. For mid case gages the User usually has to section a case and measure the wall thickness, and enter that value in “Case thickness at SG”.
- 5. “Strain Gage Factor” should be printed in your gage documentation.
- 6. Measure the lead wire internal resistance with a good Ohm meter, with one end shorted together into “Sensor Lead Resistance”. This value will be low, but normally above the .02 default. This is not the combined lead and gage resistance. GRTrace assumes the gage is a standard 350 ohm one as required by the Wheatstone Bridge within the yellow box.
- 7. Leave the “Calibration Factor” empty until you have determined the true value by test and evaluation.
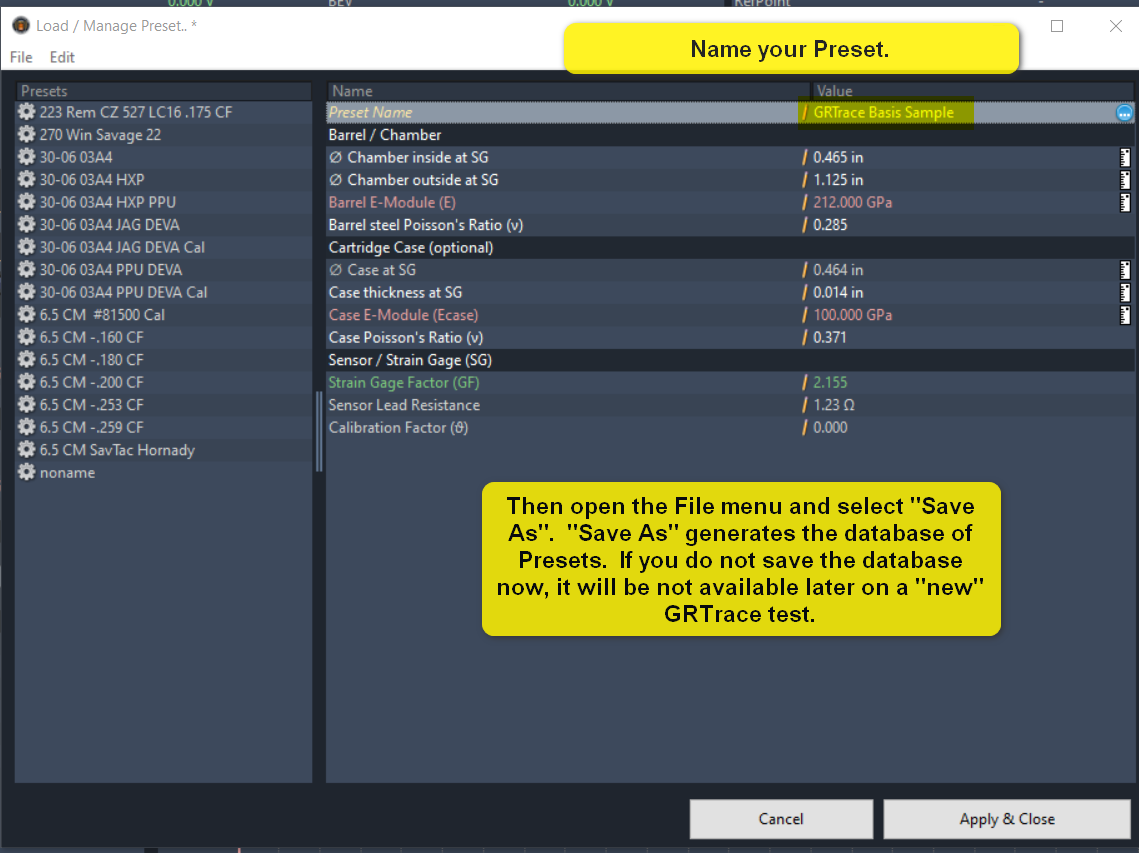
Note: Mid case gage locations result if finer reading of pressure steps, but there is often a initial delay in the start of pressure readings due the brass having to expand until it touches the chamber walls. End of mouth gages do not suffer this delay in pressure reading, but the steps in pressure is often coarser, up to twice the mid case gage depending on barrel thickness at the measurement points. Now that the basic Preset parameters are entered we need to save the data into a file that can be accessed at a later date. Either click the “load/manage” button at the top of the list of parameters, or select the File menu option that is the same. Make sure you rename the file from “noname” to something you can relate to later.
Once you have named the file, you will need to open the File menu being displayed and do a “Save As” to also save the file into a Preset database. If you do not do a “Save As” now, the Preset you have constructed will exist only in the .grtrace file you hopefully will generate when you save your project.
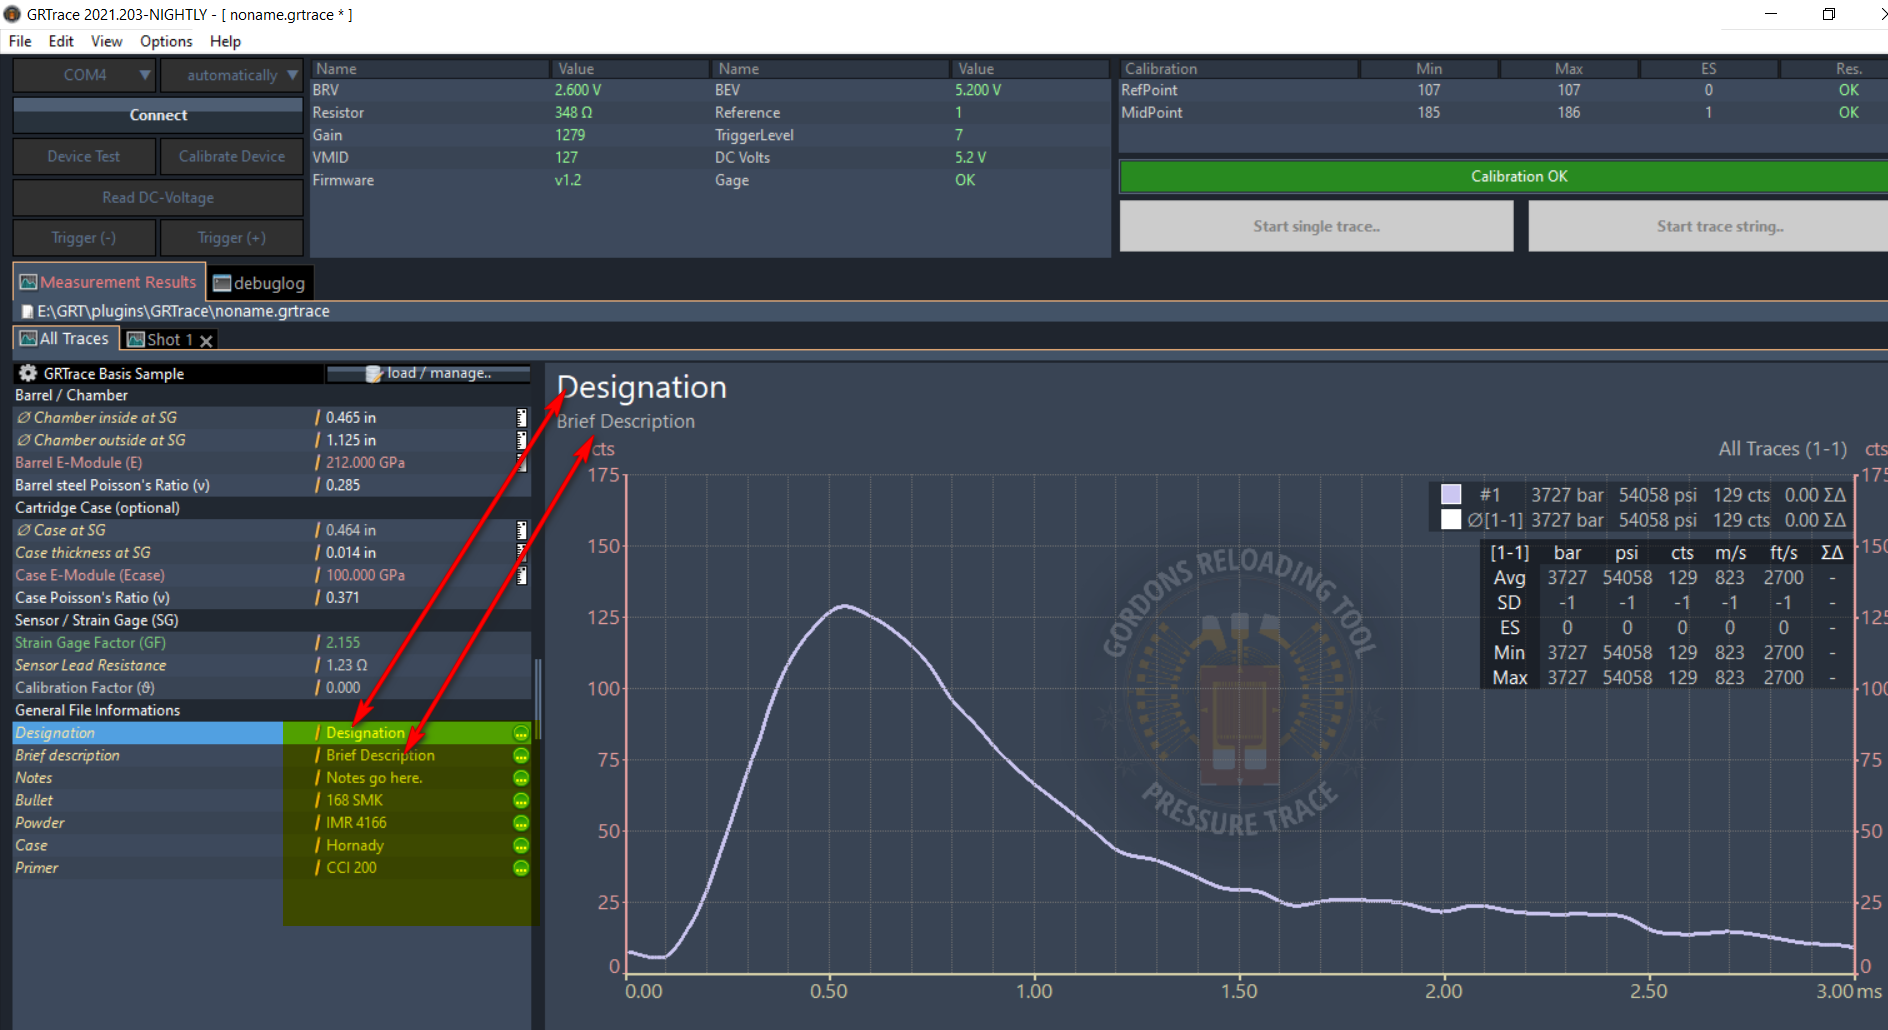
Now that the User has a Barrel Preset, he can start to measure relative pressures in his rifle. There is only the matter of finding out what the other imput fields are for, and where do they appear. First, place GRTrace in Simulator mode as mentioned above. Then fill in the “General File Information's” as required. Take note of where (if they do) appear on the Results screen for “All Traces”. Not all show up in the Results screen, some are for User reference while viewing the graphs only.
Now click on the “Connect” button. The program will simulate the normal calibration routine seen in the field, but hidden by the RSI software. The User can now look in the “debuglog” tab and view the list of commands and device outputs. This debug screen can be useful if the User has trouble with the PT2 box, cables, or noise generated in the environment as he uses his PT2. All of the limited commands that are used to control the device are simulated through the various buttons under the “Connect” / “Disconnect” buttons at the upper left of the main screen. The simulator will at times even generate errors so the User can get used to seeing them.
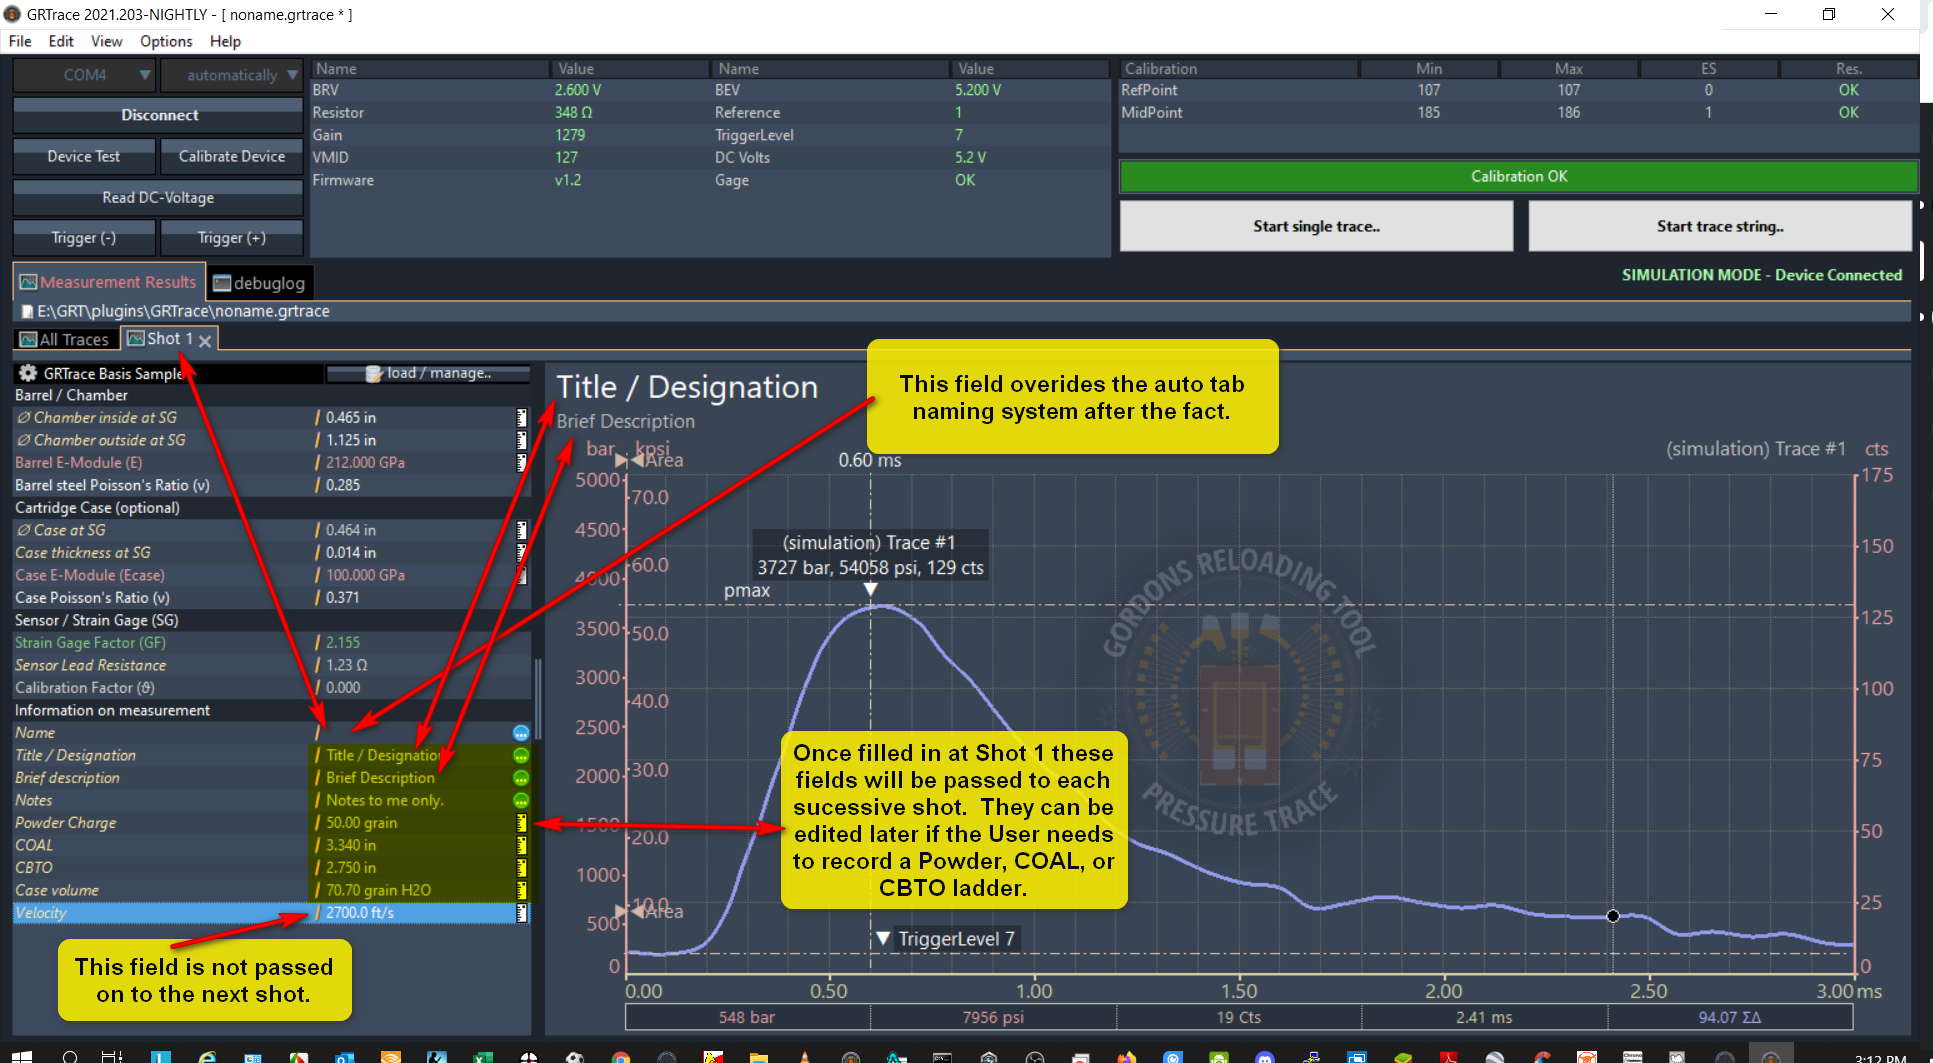
Now we are ready to do a simulated shot. From the “All Traces” tab view, click the “Start single trace” button. You should hear Gordon's audio prompt unless you have turned those off in the Options menu. A new Shot tab should appear, and will be auto numbered as Shot 1, Shot 2, etc. unless the User over types this auto numbering using the “Name” field in the “Information on measurement”. I suggest this “Name” field not be used until the shot series is finished. Most of these fields are passed on to the next Shot except the “Name” and the “Velocity”.
At any time during the gathering of data the User can save the work to a .grtrace file. The User is not restricted to end of test for saving, and editing. The whole test can be interrupted and restarted again at the Users whim. If the User loads a file from storage, he can append new Shots to the end of his file. The User can also load a file than has multiple Shots, edit out Shots and save the file under a new name, thus preserving the original data, and generating different looks into existing data. It is up to the Users imagination how far this can go. Personally, I use keyboard CTRL + S for every shot, and sometimes more often. It is so easy to maintain data integrity.
Once the User is familiar with the system, he can start to use the “Start trace string” button option. Remember in simulator mode the system will generate errors so the User can get recognize these in the field.
Words of Caution
If you have problems connecting the PT2 device, either using the original RSI software, or GRTrace, the problem is often traced to Windows (10) losing track of which COM port it is suppose to use. It seems the Plug and Play system is a bit senile, and gets lost at times especially if the PC has detected Blue Tooth devices nearby during the PC startup. What I have found to work well is, after you are certain which COM port is being used at home, open Device Manager, and disable all COM ports except the one that worked at home. That seems to disable the Plug and Play, and allow the system to communicate. There may be a better explanation, but that is what seems to be happening to me.
Sample Output File
Users may download this file to be able to see what a nearly complete fill out looks like. Once downloaded, a double click on the file should load and launch GRTrace.